We now have three layers stored in PostGIS and published in Geoserver, one layer of points (monuments), one layer of lines (world-rivers), and one layer of polygons (world-administrative-boundaries). However, our OpenLayers map only shows the monuments for now. Let's see how we can load, style, and display our two other WFS layers.

- Let's make a few adjustments to the resources/js/components/maps.js file:
import Map from "ol/Map.js";
import View from "ol/View.js";
import TileLayer from "ol/layer/Tile.js";
import VectorSource from "ol/source/Vector";
import VectorLayer from "ol/layer/Vector";
import OSM from "ol/source/OSM.js";
import { Style, Fill, Stroke, Circle, Text } from "ol/style.js";
import GeoJSON from "ol/format/GeoJSON";
import Overlay from "ol/Overlay.js";

document.addEventListener("alpine:init", () => {
    Alpine.data("map", function () {
        return {
            legendOpened: false,
            map: {},
            initComponent() {
                const paramsObj = {
                let paramsObj = {
                    servive: "WFS",
                    version: "2.0.0",
                    request: "GetFeature",
// Remove the layer reference from to URL params objets to be able to reuse it
                    typeName: "laravelgis:monuments",
                    outputFormat: "application/json",
                    crs: "EPSG:4326",
                    srsName: "EPSG:4326",
                };

                const urlParams = new URLSearchParams(paramsObj);
                const monumentsUrl =
                    "http://localhost:8080/geoserver/wfs?" +
                    urlParams.toString();
// Create a variable for Geoserver WFS base URL
                const baseUrl = "http://localhost:8080/geoserver/wfs?";

// Adjust the URL parameters for the monuments
                paramsObj.typeName = "laravelgis:monuments";
                let urlParams = new URLSearchParams(paramsObj);

// Create the monuments layer with the base WFS url and the adjusted parameters
                let monumentsLayer = new VectorLayer({
                    source: new VectorSource({
                        format: new GeoJSON(),
                        url: baseUrl +  urlParams.toString(),
                    }),
// We renamed the styleFunction to monumentsStyleFunction so we can have a style function per layer
                    style: this.monumentsStyleFunction,
                    label: 'Monuments',
                });

// Adjust the URL parameters for the world-administrative-boundaries WFS service
                paramsObj.typeName = "laravelgis:world-administrative-boundaries";
                urlParams = new URLSearchParams(paramsObj);

// Create the world-administrative-boundaries layer with the base WFS url and the adjusted parameters
                let worldAdministrativeBoundariesLayer = new VectorLayer({
                    source: new VectorSource({
                        format: new GeoJSON(),
                        url: baseUrl +  urlParams.toString(),
                    }),
// We created a new style function for the polygons layer
                    style: this.worldAdministrativeBoundariesStyleFunction,
                    label: 'World Administrative Boundaries',
                });

// Adjust the URL parameters for the world-rivers WFS service
                paramsObj.typeName = "laravelgis:world-rivers";
                urlParams = new URLSearchParams(paramsObj);

// Create the world-rivers layer with the base WFS url and the adjusted parameters
                let worldRiversLayer = new VectorLayer({
                    source: new VectorSource({
                        format: new GeoJSON(),
                        url: baseUrl +  urlParams.toString(),
                    }),
// We created a new style function for the lines layer
                    style: this.worldRiversStyleFunction,
                    label: 'World Rivers',
                });

                this.map = new Map({
                    target: this.$refs.map,
                    layers: [
                        new TileLayer({
                            source: new OSM(),
                            label: 'OpenStreetMap',
                        }),
                        new VectorLayer({
                            source: new VectorSource({
                                format: new GeoJSON(),
                                url: monumentsUrl,
                            }),
                            style: this.styleFunction,
                            label: 'Monuments',
                        }),
// We add our three layers variables  to the map instead of creating them inline
                        worldAdministrativeBoundariesLayer,
                        worldRiversLayer,
                        monumentsLayer
                    ],
                    view: new View({
                        projection: "EPSG:4326",
                        center: [0, 0],
                        zoom: 2,
                    }),
                    overlays: [
                        new Overlay({
                            id: 'info',
                            element: this.$refs.popup,
                            stopEvent: true,
                        }),
                    ],
                });

                this.map.on("singleclick", (event) => {
                    if (event.dragging) {
                        return;
                    }

                    let overlay = this.map.getOverlayById('info')
                    overlay.setPosition(undefined)
                    this.$refs.popupContent.innerHTML = ''

                    this.map.forEachFeatureAtPixel(
                        event.pixel,
                        (feature, layer) => {
                            if (layer.get('label') === 'Monuments' && feature) {
                                this.gotoFeature(feature)

                                let content =
                                    '<h4 class="text-gray-500 font-bold">' +
                                    feature.get('name') +
                                    '</h4>'

                                content +=
                                    '<img src="' +
                                    feature.get('image') +
                                    '" class="mt-2 w-full max-h-[200px] rounded-md shadow-md object-contain overflow-clip">'

                                this.$refs.popupContent.innerHTML = content

                                setTimeout(() => {
                                    overlay.setPosition(
                                        feature.getGeometry().getCoordinates()
                                    );
                                }, 500)

                                return
                            }
                        },
                        {
                            hitTolerance: 5,
                        }
                    );
                });
            },
            closePopup() {
                let overlay = this.map.getOverlayById('info')
                overlay.setPosition(undefined)
                this.$refs.popupContent.innerHTML = ''
            },
// We renamed the styleFunction to monumentsStyleFunction so we can have a style function per layer
            styleFunction(feature, resolution) {
            monumentsStyleFunction(feature, resolution) {
                return new Style({
                    image: new Circle({
                        radius: 4,
                        fill: new Fill({
                            color: "rgba(0, 255, 255, 1)",
                        }),
                        stroke: new Stroke({
                            color: "rgba(192, 192, 192, 1)",
                            width: 2,
                        }),
                    }),
                    text: new Text({
                        font: "12px sans-serif",
                        textAlign: "left",
                        text: feature.get("name"),
                        offsetY: -15,
                        offsetX: 5,
                        backgroundFill: new Fill({
                            color: "rgba(255, 255, 255, 0.5)",
                        }),
                        backgroundStroke: new Stroke({
                            color: "rgba(227, 227, 227, 1)",
                        }),
                        padding: [5, 2, 2, 5],
                    }),
                });
            },
// New style function for the polygons layer
            worldAdministrativeBoundariesStyleFunction(feature, resolution) {
                return new Style({
                    fill: new Fill({
                        color: "rgba(125, 125, 125, 0.1)",
                    }),
                    stroke: new Stroke({
                        color: "rgba(125, 125, 125, 1)",
                        width: 2,
                    }),
                    text: new Text({
                        font: "16px serif bold",
                        text: feature.get("name"),
                        fill: new Fill({
                            color: "rgba(32, 32, 32, 1)",
                        }),
                    }),
                });
            },
// New style function for the lines layer
            worldRiversStyleFunction(feature, resolution) {
                let text;
                let width = 2;

// We only display the labels for this layer when the resolution in less than 0.002 (arbitrary value)
// The labels for the rivers will only be shown when the map is zoomed in to a certain level
                if(resolution < 0.002){
                    text = new Text({
                        font: "20px serif",
// The name field for the rivers is called "river_map" in the database (and published WFS)
                        text: feature.get("river_map"),
                        fill: new Fill({
                            color: "rgba(0, 0, 255, 1)",
                        }),
                    });

                    width = 4;
                }

                return new Style({
                    stroke: new Stroke({
                        color: "rgba(0, 0, 255, 1)",
                        width: width,
                     }),
                     text: text,
                });
            },
            gotoFeature(feature) {
                 this.map.getView().animate({
                     center: feature.getGeometry().getCoordinates(),
                     zoom: 15,
                     duration: 500,
                });
            },
        };
    });
});
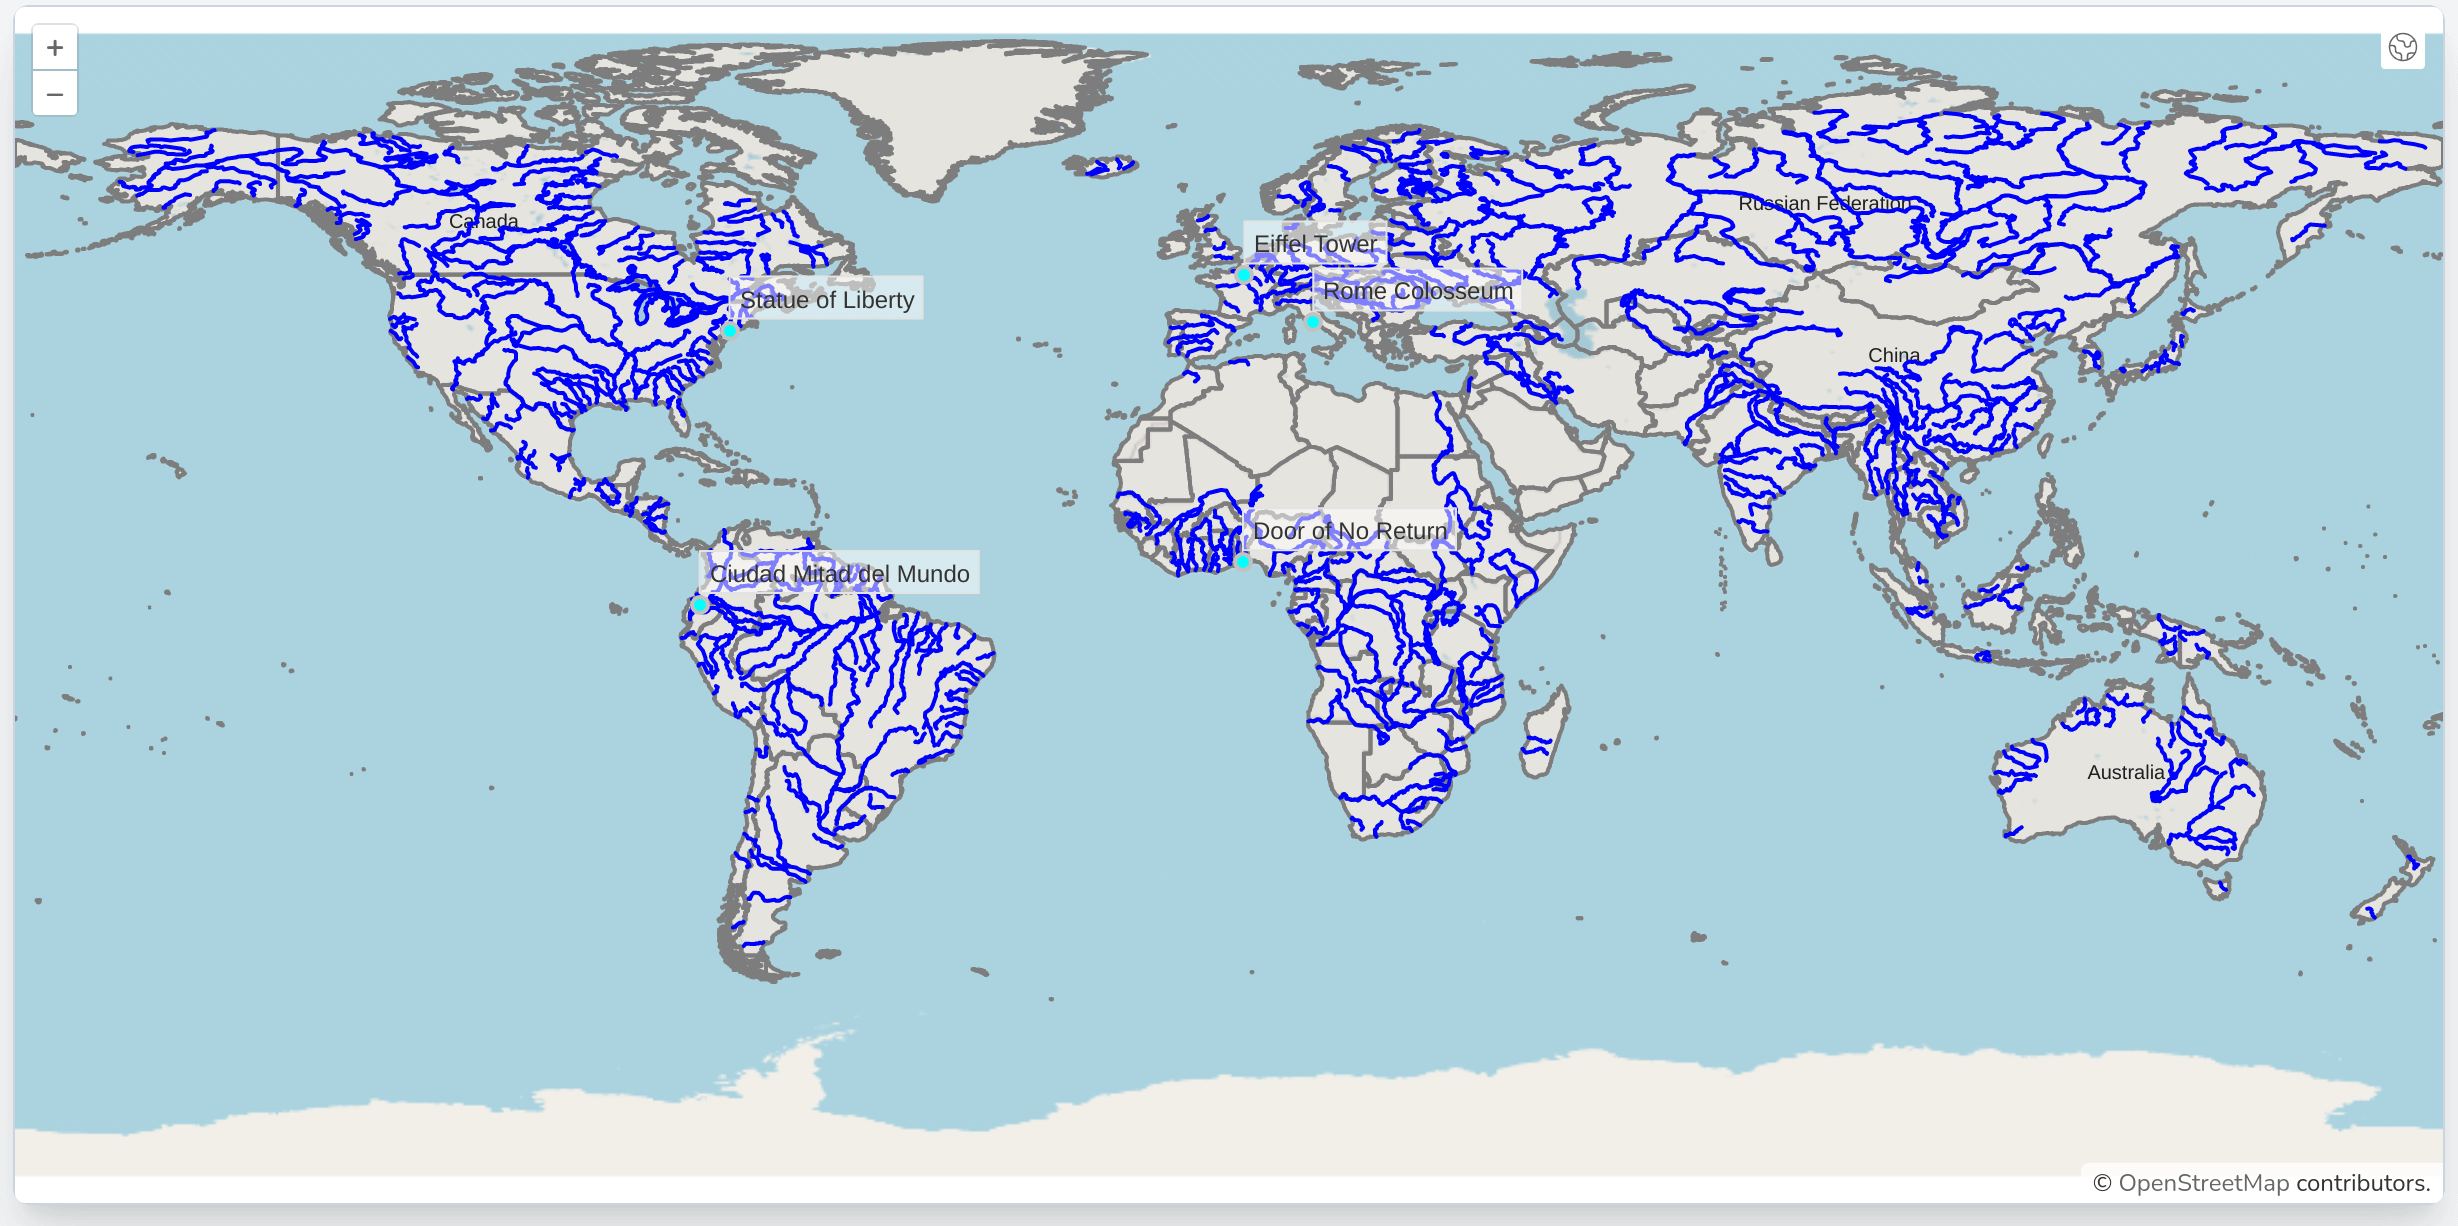
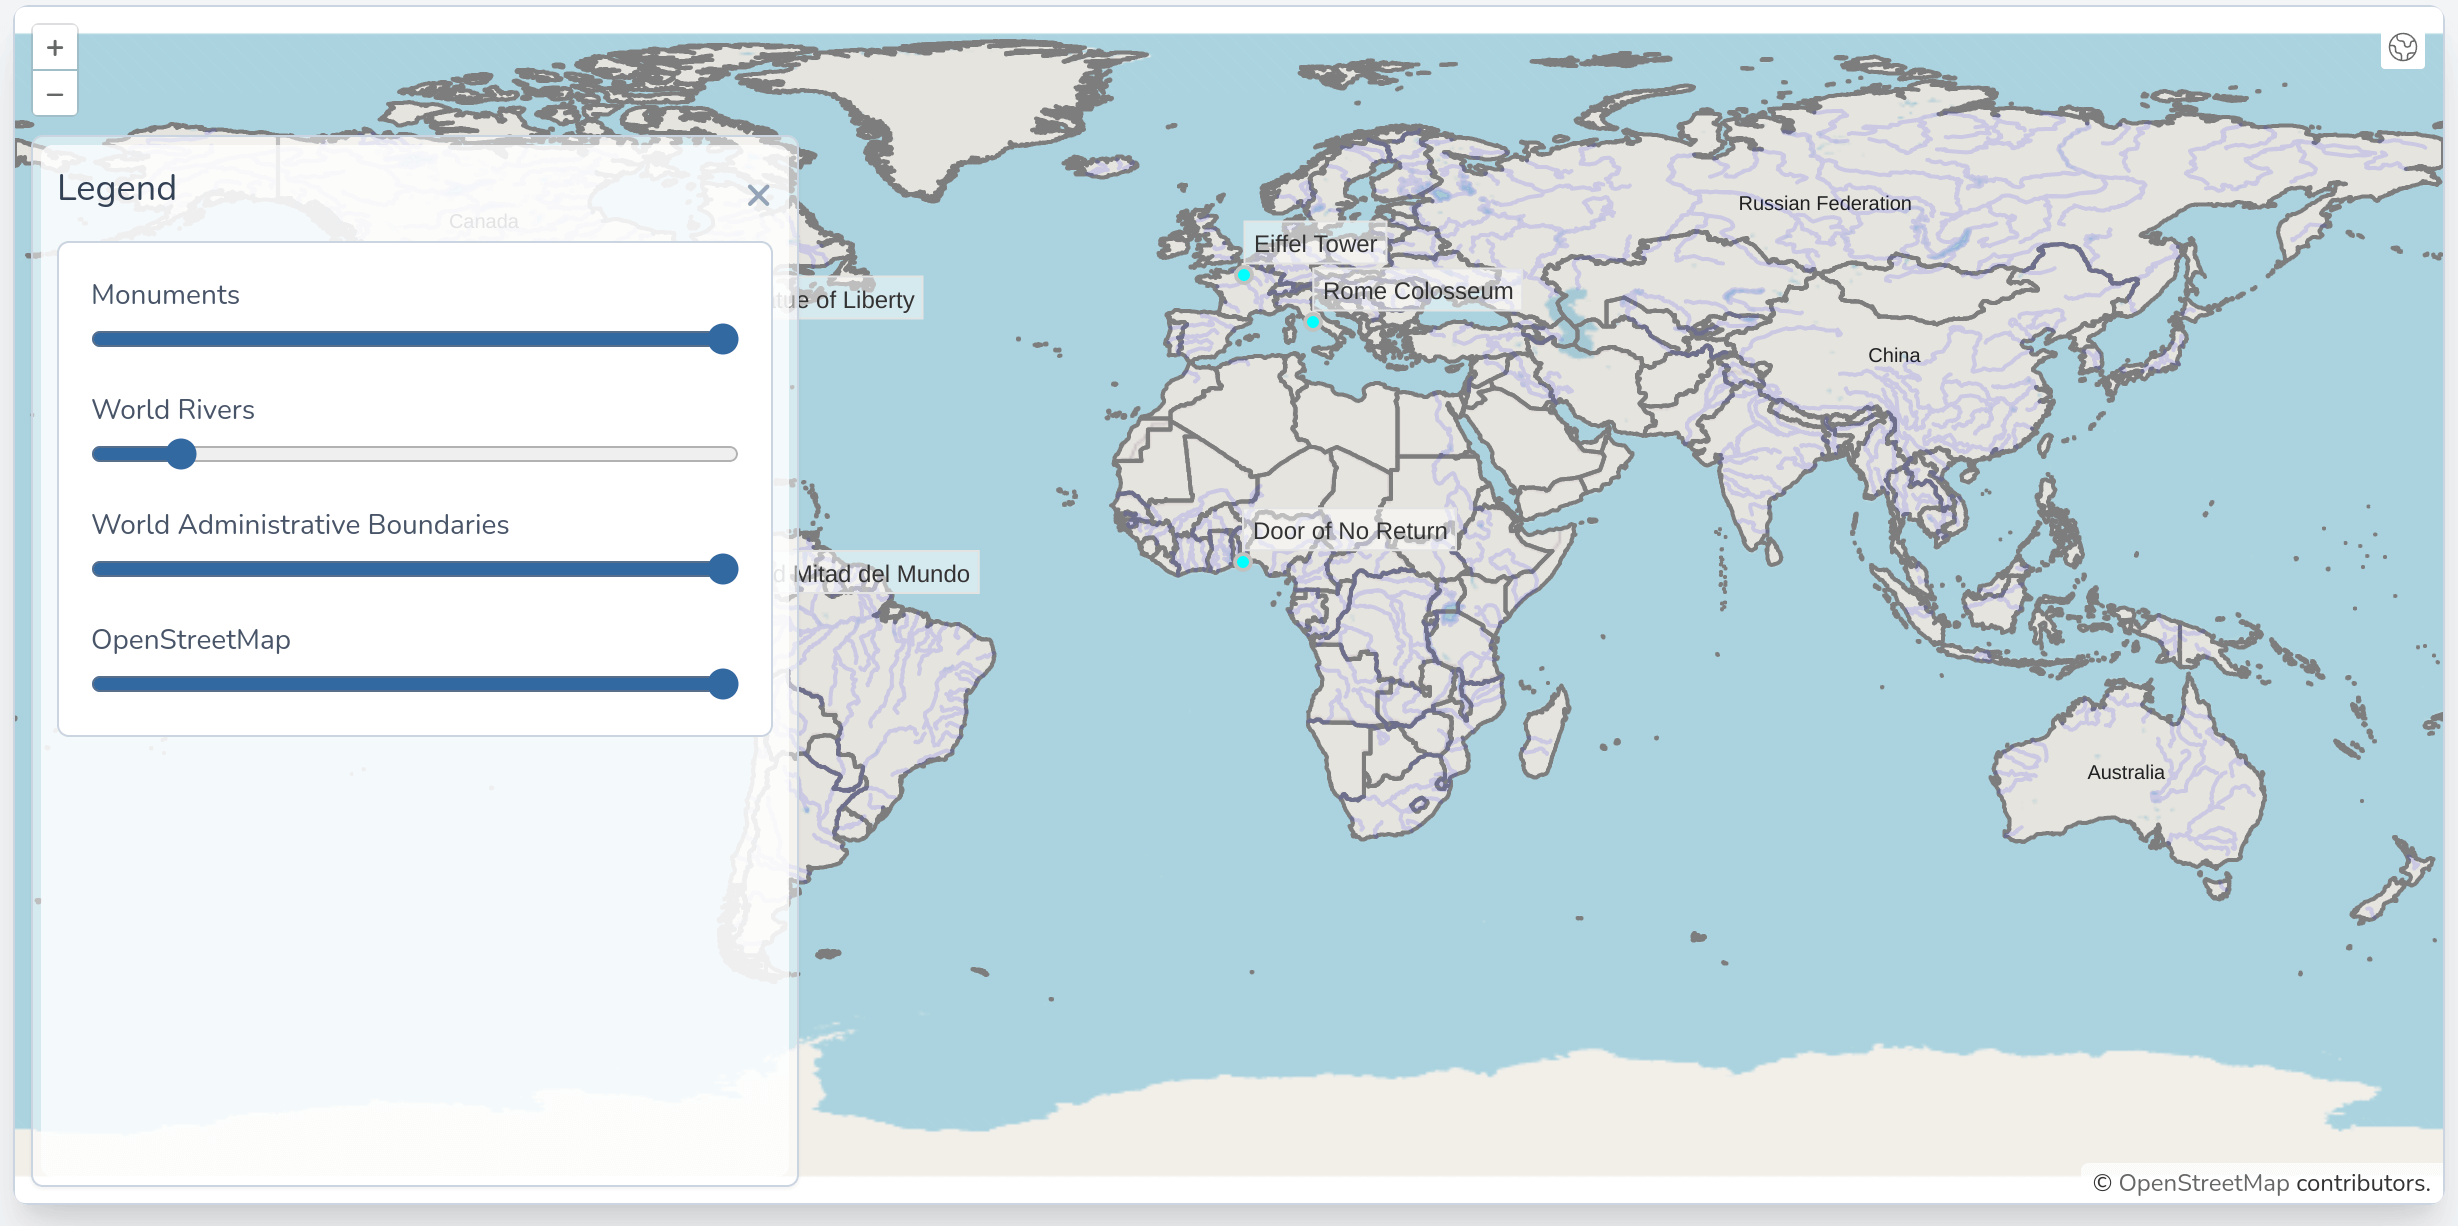
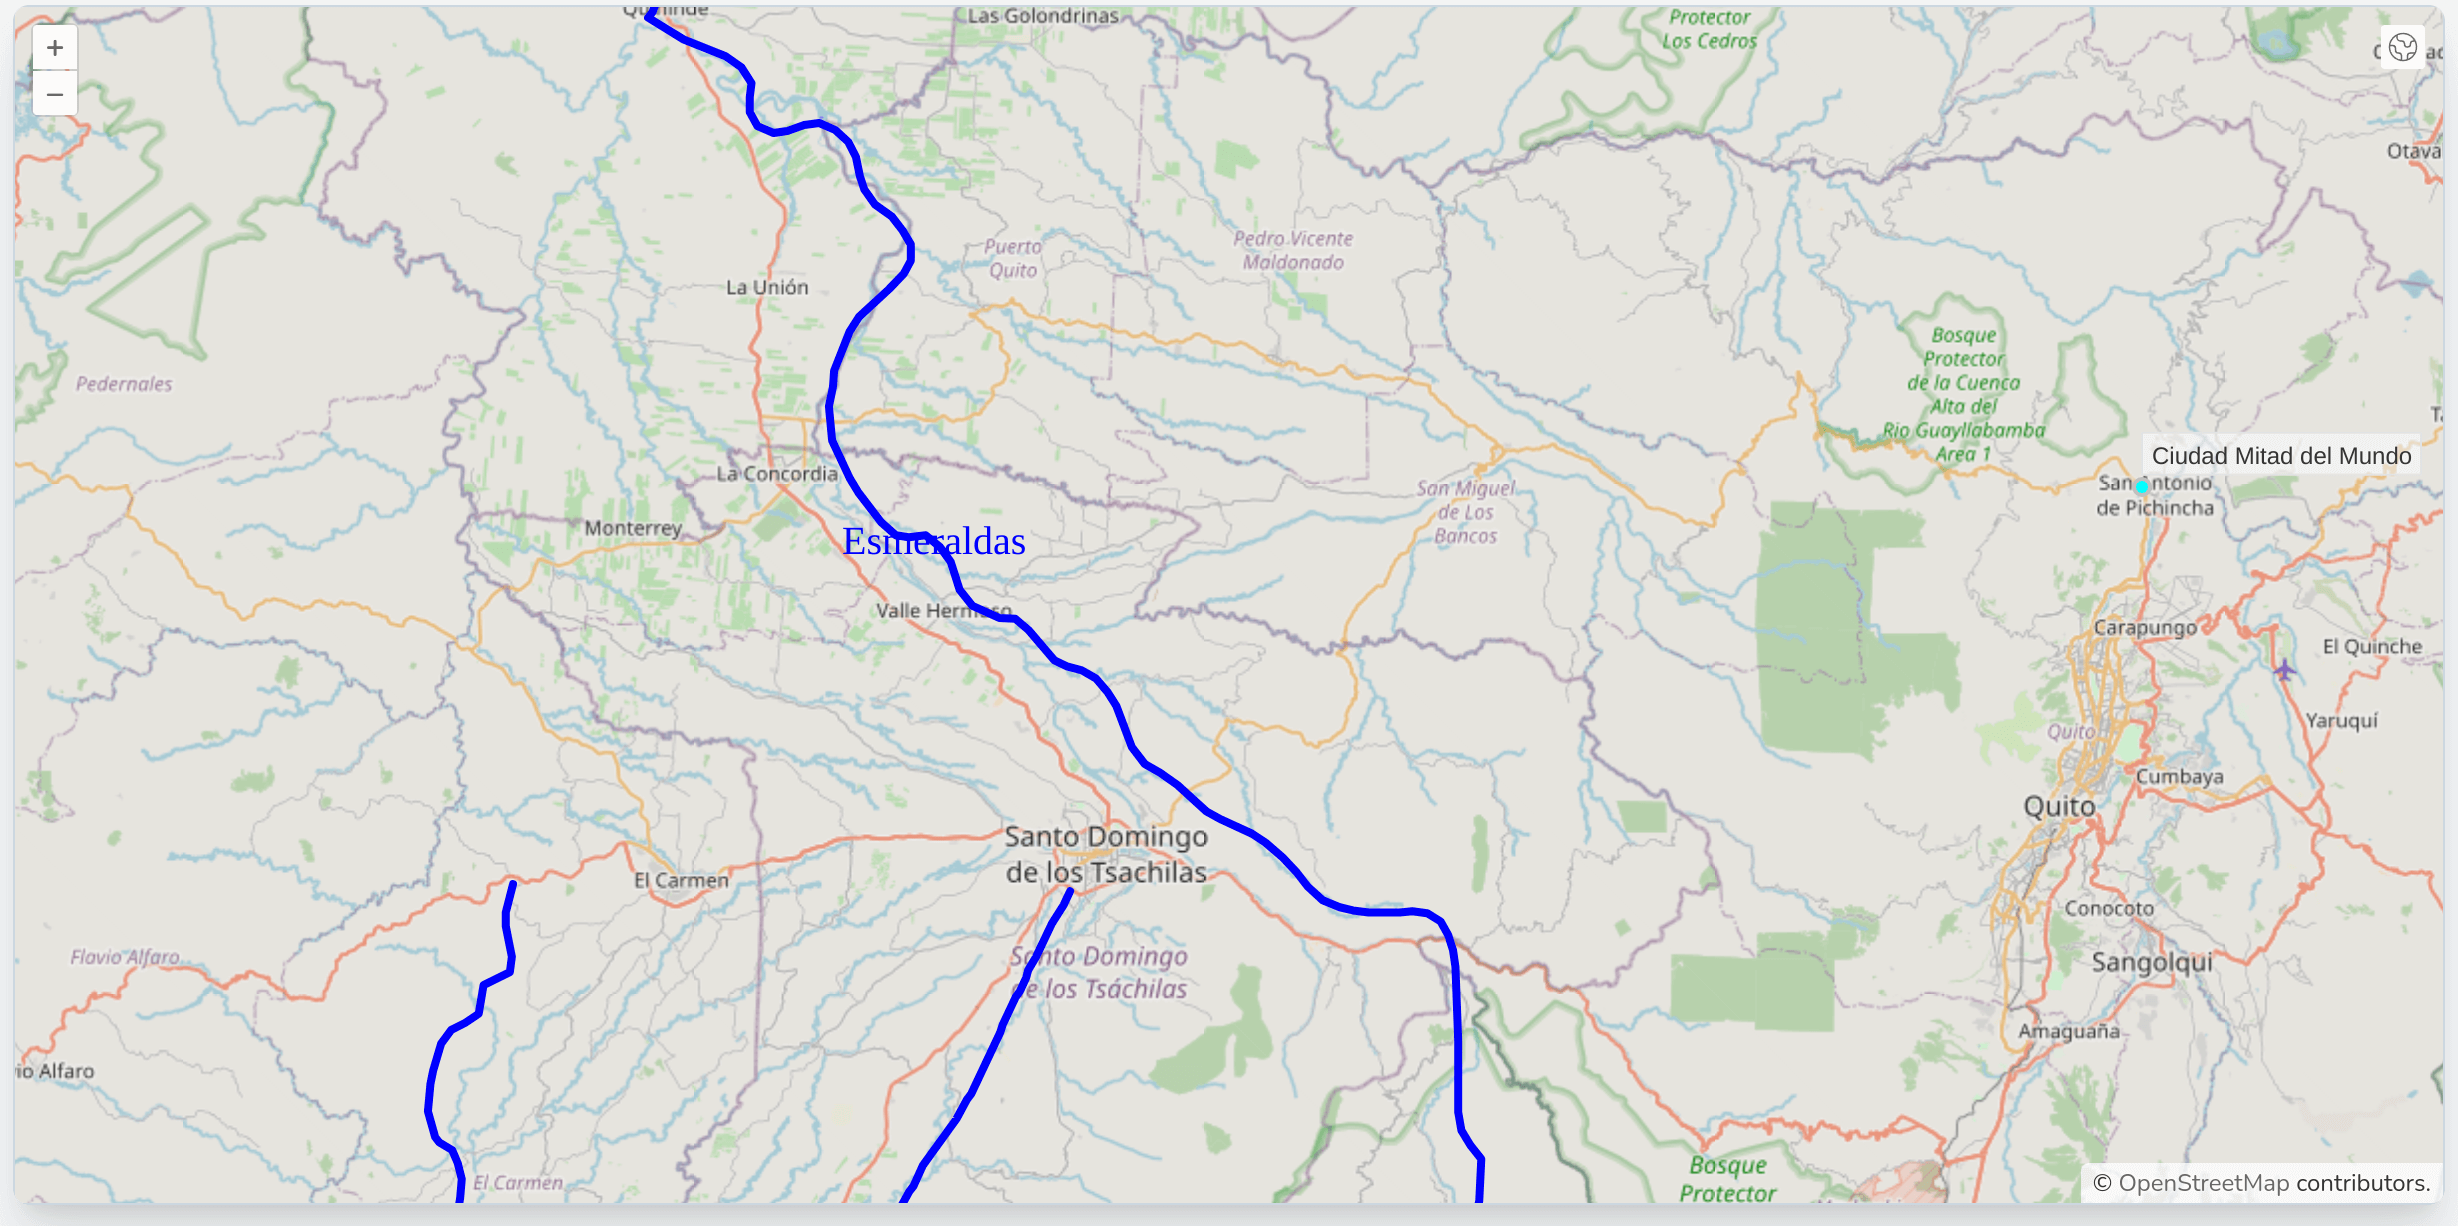
- As seen in the images below, we now see the new layers on the map with the symbols we defined in the new style functions. Our legend is still working and adjusted dynamically. We can also see that the river labels only appear when the map is zoomed in.
- Everything looks great now, but let's point out a performance problem with our map. First, let's have a look at the network tab in the browser's developer's tools to see what's loading exactly:
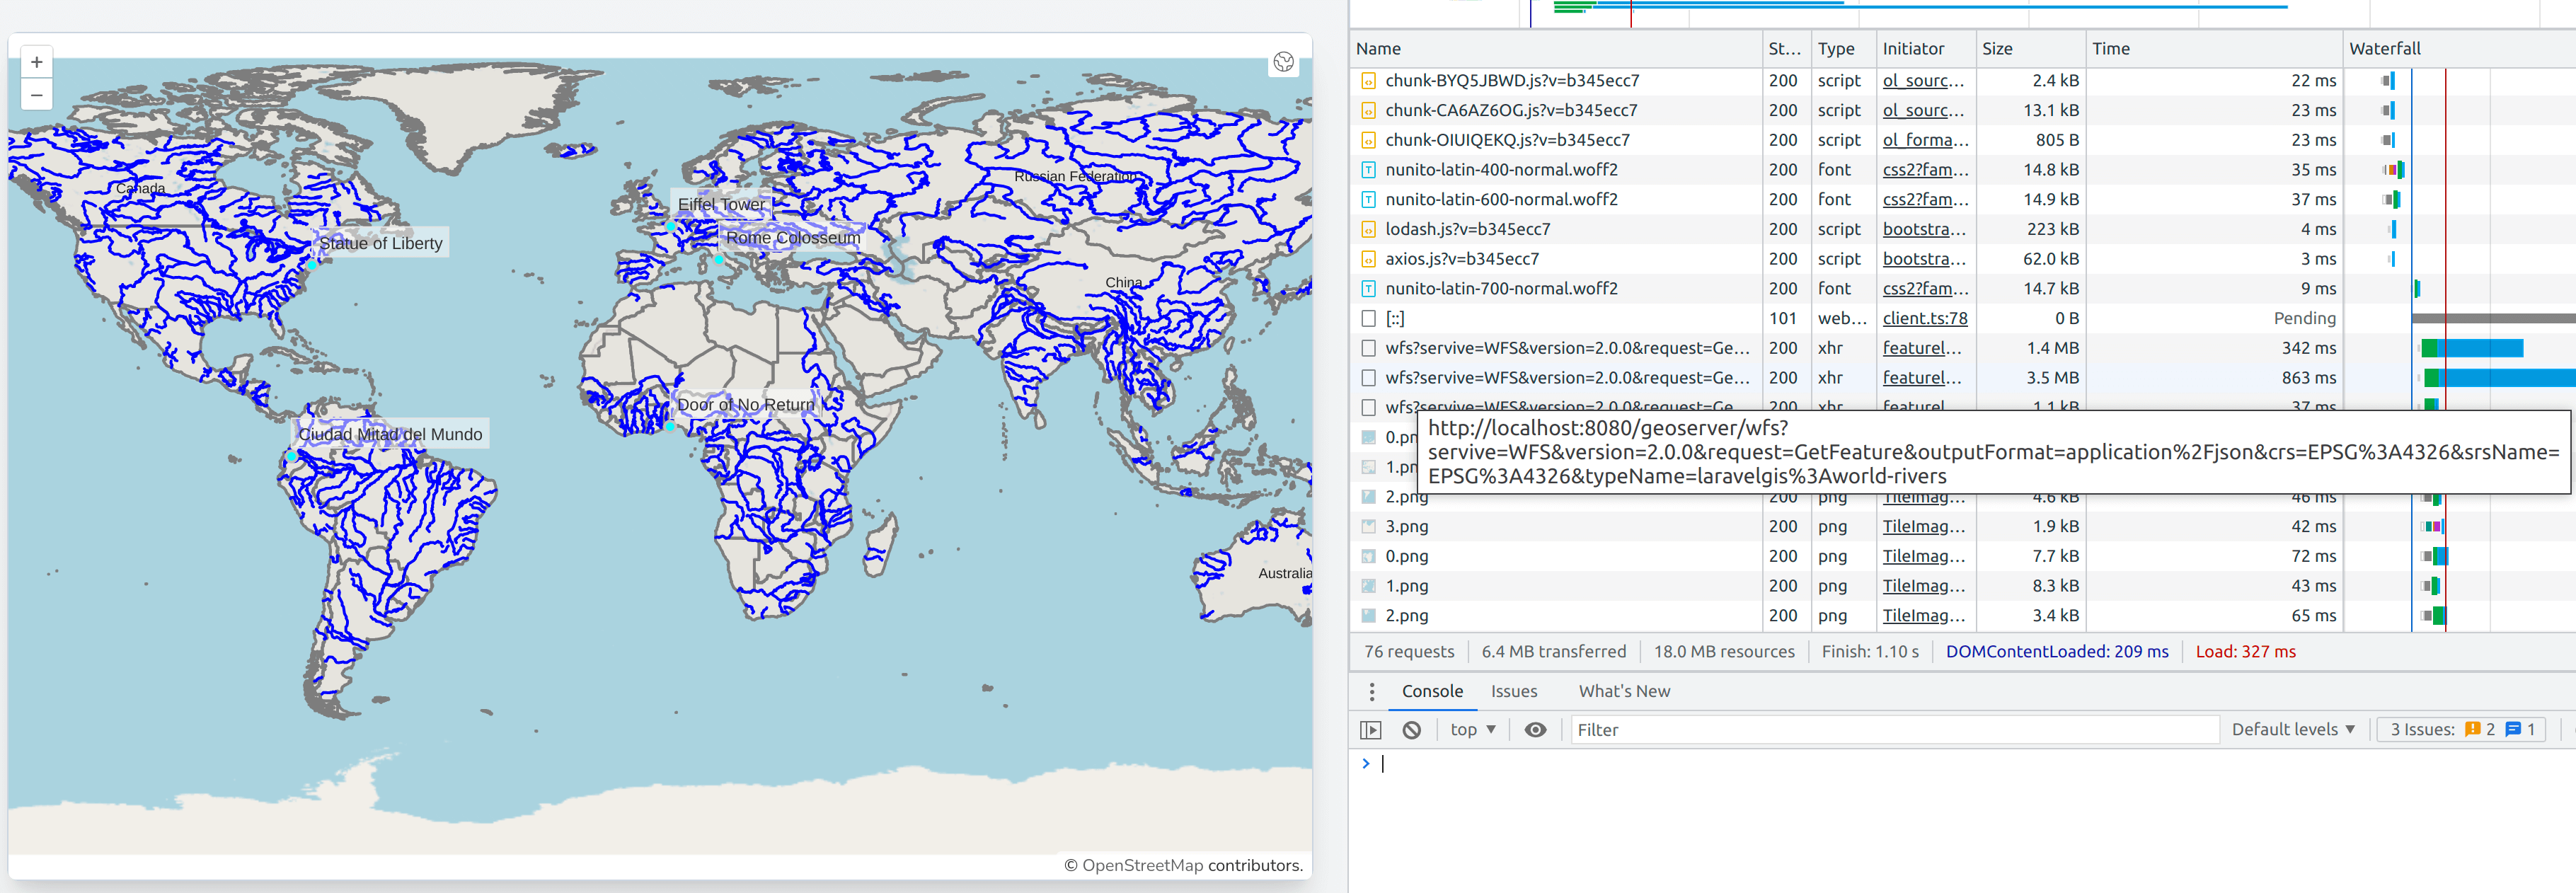
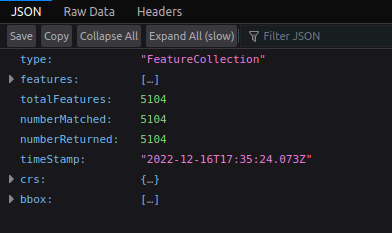
- The WFS requests are enormous (more than 3MB for the rivers only). If we open the WFS link directly in a new tab, we can see that 5104 rivers (all of the records) are loaded!
- Now let's change the initial extent for the map in the resources/js/components/map.js to have it zoomed in and see what's happening with the network tab.
(...)
                this.map = new Map({
                    target: this.$refs.map,
                    layers: [
                        new TileLayer({
                            source: new OSM(),
                            label: 'OpenStreetMap',
                        }),
                        worldAdministrativeBoundariesLayer,
                        worldRiversLayer,
                        monumentsLayer
                    ],
                    view: new View({
                        projection: "EPSG:4326",
                        center: [0, 0],
                        zoom: 2,
                        center: [-78.2161, -0.7022],
                        zoom: 8,
                    }),
                    overlays: [
                        new Overlay({
                            id: 'info',
                            element: this.$refs.popup,
                            stopEvent: true,
                        }),
                    ],
                });
(...)
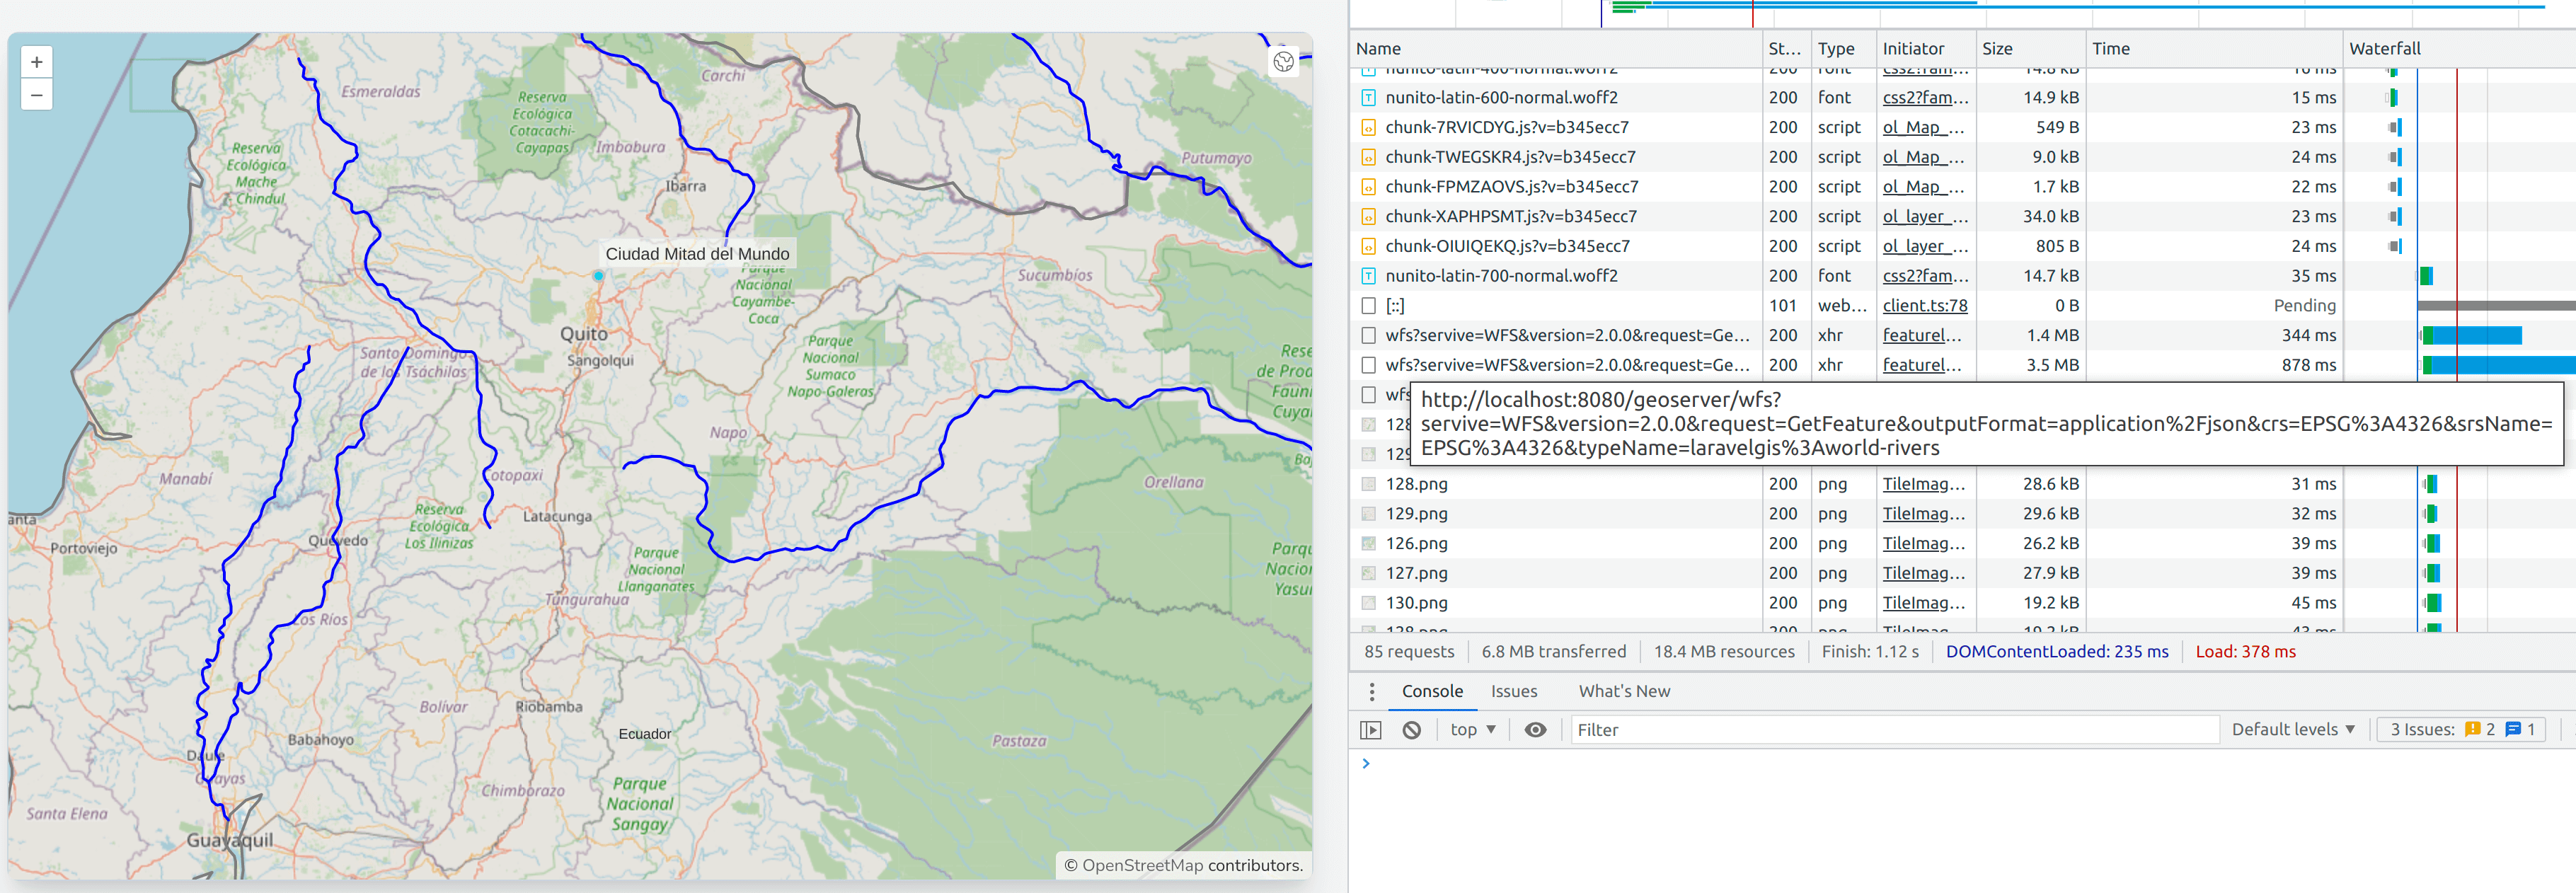
- We can see that, even when zoomed in and seeing only 5 or 6 rivers on the map, all of the rivers in the layer are still loaded (along with their attributes and geometry) in the browser. This can quickly become a significant performance issue.
- There is a way in OpenLayers to get around this problem and only load features visible in the map based on it's bounding box (geoserver will perform a spatial query), let's implement it with the rivers layer in the resources/js/components/map.js:
import Map from "ol/Map.js";
import View from "ol/View.js";
import TileLayer from "ol/layer/Tile.js";
import VectorSource from "ol/source/Vector";
import VectorLayer from "ol/layer/Vector";
import OSM from "ol/source/OSM.js";
import { Style, Fill, Stroke, Circle, Text } from "ol/style.js";
import GeoJSON from "ol/format/GeoJSON";
import Overlay from "ol/Overlay.js";
import { bbox as bboxStrategy } from "ol/loadingstrategy.js";
(...)
                paramsObj.typeName = "laravelgis:world-rivers";
                urlParams = new URLSearchParams(paramsObj);

                let worldRiversLayer = new VectorLayer({
                    source: new VectorSource({
                        format: new GeoJSON(),
// We use a callback instead of a value for the url property, it automatically gets the extent as a parameter
// We then pass it to the url and use the bbox strategy from openlayers
                        url: baseUrl +  urlParams.toString(),
                        url: (extent) => {
                            paramsObj.typeName = "laravelgis:world-rivers";
                            paramsObj.bbox = extent.join(",") +  ",EPSG:4326";
                            let urlParams = new URLSearchParams(paramsObj);
                            return baseUrl +  urlParams.toString();
                        },
                        strategy: bboxStrategy,
                    }),
                    style: this.worldRiversStyleFunction,
                    label: 'World Rivers',
                });
(...)
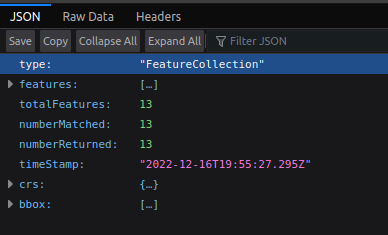
- Now the WFS request is down to 14kB, and only 13 features are loaded; that's a massive improvement!

- Let's apply the same fix to the monuments and world-administrative-boundaries in the resources/js/components/map.js:
(...)
                paramsObj.typeName = "laravelgis:monuments";
                let urlParams = new URLSearchParams(paramsObj);

                let monumentsLayer = new VectorLayer({
                    source: new VectorSource({
                        format: new GeoJSON(),
                        url: baseUrl +  urlParams.toString(),
                        url: (extent) => {
                            paramsObj.typeName = "laravelgis:monuments";
                            paramsObj.bbox = extent.join(",") +  ",EPSG:4326";
                            let urlParams = new URLSearchParams(paramsObj);
                            return baseUrl +  urlParams.toString();
                        },
                        strategy: bboxStrategy,
                    }),
                    style: this.monumentsStyleFunction,
                    label: 'Monuments',
                });

                paramsObj.typeName = "laravelgis:world-administrative-boundaries";
                urlParams = new URLSearchParams(paramsObj);

                let worldAdministrativeBoundariesLayer = new VectorLayer({
                    source: new VectorSource({
                        format: new GeoJSON(),
                        url: baseUrl +  urlParams.toString(),
                        url: (extent) => {
                            paramsObj.typeName = "laravelgis:world-administrative-boundaries";
                            paramsObj.bbox = extent.join(",") +  ",EPSG:4326";
                            let urlParams = new URLSearchParams(paramsObj);
                            return baseUrl +  urlParams.toString();
                        },
                        strategy: bboxStrategy,
                    }),
                    style: this.worldAdministrativeBoundariesStyleFunction,
                    label: 'World Administrative Boundaries',
                });

                let worldRiversLayer = new VectorLayer({
                    source: new VectorSource({
                        format: new GeoJSON(),
                        url: (extent) => {
                            paramsObj.typeName = "laravelgis:world-rivers";
                            paramsObj.bbox = extent.join(",") +  ",EPSG:4326";
                            let urlParams = new URLSearchParams(paramsObj);
                            return baseUrl +  urlParams.toString();
                        },
                        strategy: bboxStrategy,
                    }),
                    style: this.worldRiversStyleFunction,
                    label: 'World Rivers',
                });
(...)
- Our three WFS layers are now optimized with the bounding box strategy and are less than 15kB at this scale:

- You might think that we are "in business" and all performance issues are fixed, but no, we are still left with many problems:
- If we zoom out to the world's level, we are back to the same problem, loading MBs of data on a single page;
- Even when the map is zoomed in, we load all of the features attributes even if we don't use them;
- Our javascript component is quickly becoming a mess, with tons of hardcoded stuff for loading, styling, and optimizing our layers;
- If we later want to change the styles or the labels for our layers, we will have to get back to programming, recompile our scripts and redeploy the application.
So, what is the problem, then? The problem is that we are using vector layers where we don't need to; there are only a few reasons/justifications for using vector layers on the web! We must use image or tile layers with server-side symbols (styles) here. Fortunately, there is a web standard for this, and the geoserver/openlayers couple is very good at implementing it. It's called WMS, and we will cover it in the next post.
The commit for this post is available here: loading-and-optimizing-wfs-layers
Nicely done concerning the performance issue with vector layers, i.e. your bbox strategy in Laravel. Here is mine following along succesfully your tutorial:
Looking forward for tommorow how we can further improve with tile layers in chapter 13.